How to get statistics from EDP dialogues
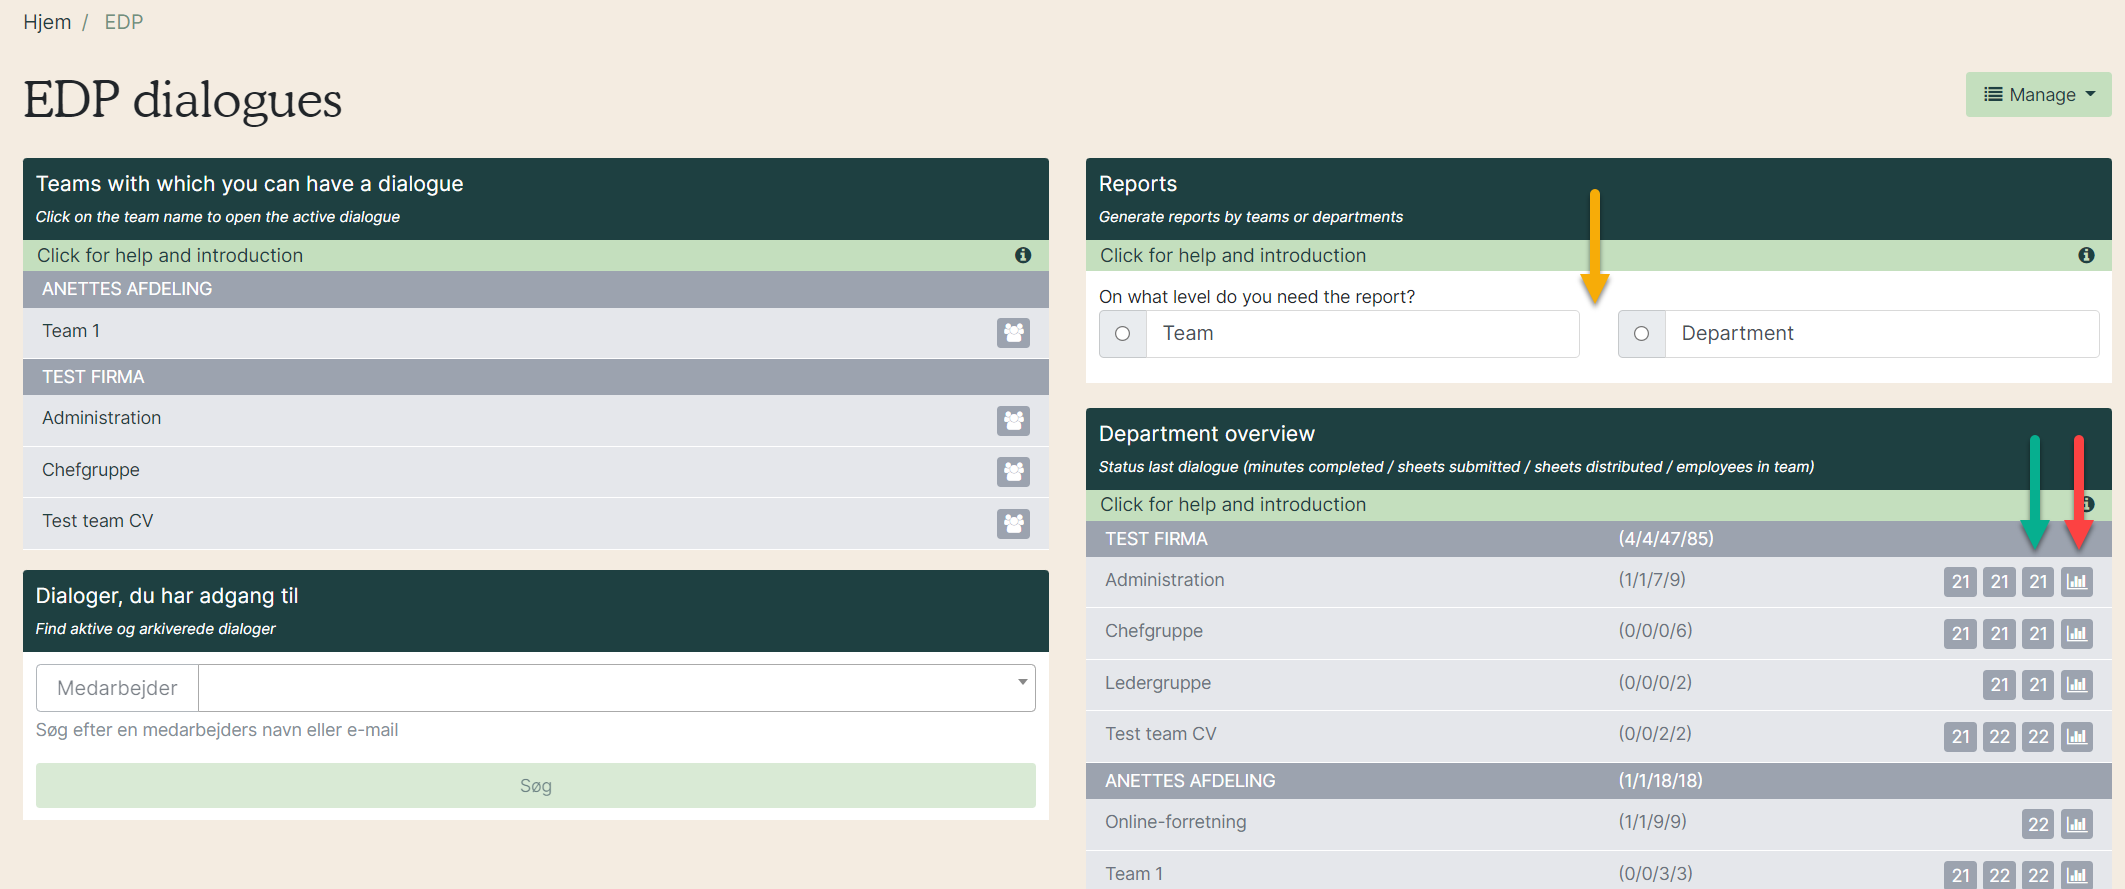
1. Go to the EDP tool, where there are several options for statistical reports.
- Yellow arrow: Advanced statistics with filters.
- Green arrow: PDF statistic for specific dialogue round.
- Red arrow: PDF aggregated statistics from the EDP of the last three years.
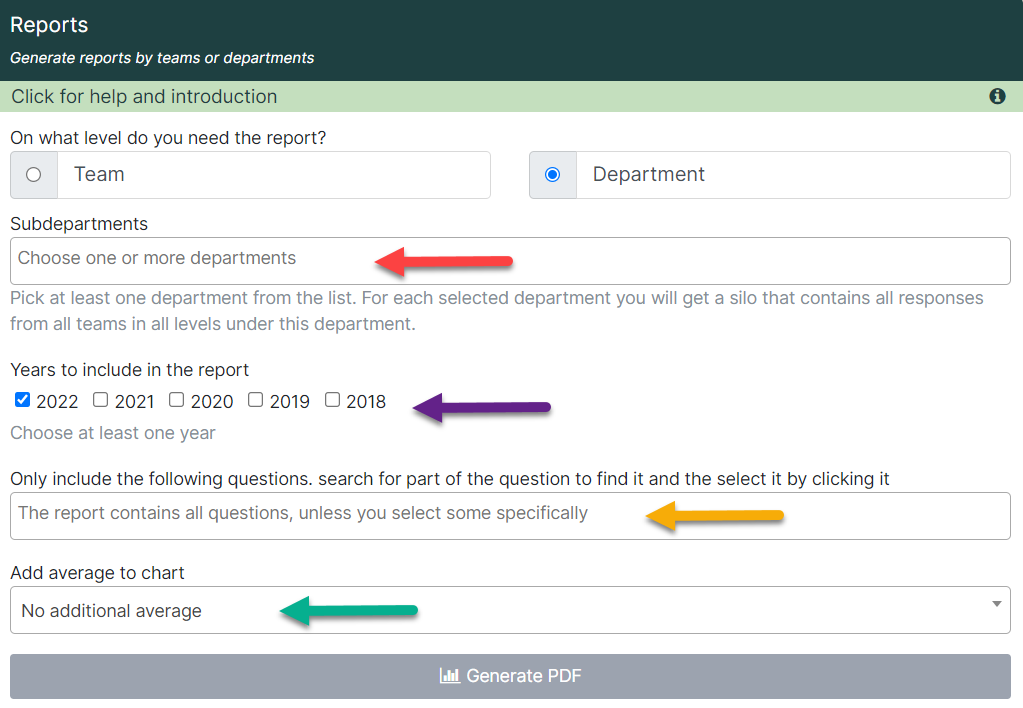
2. The advanced statistics gives the following options:
- Red arrow: Choose team or department. You can choose several for comparison.
- Purple arrow: Choose a year or latest round of dialogue.
- Yellow arrow: Choose specific questions to measure. If you want all questions in the report, you do not choose anything here.
- Green arrow: Choose if the organization’s average should be included or not.
Finish by clicking ” Generate PDF”.
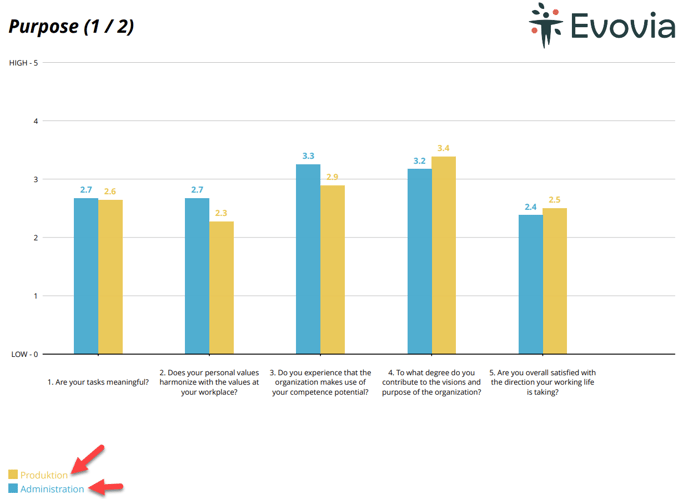
3. The graph shows the selected teams next to each other with different colors (red arrow).
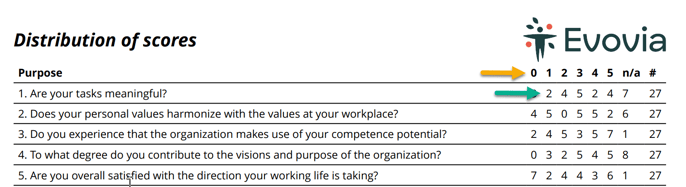
4. The last pages in the PDF show the distribution of answers - that is; how many have scored which values. The yellow arrow point to the scores from 0-5. Green arrow is how many have scored each value. 2 persons has scored 1 and 4 persons have scored 5 on the question etc.